Playbook for Handling Runaway Grafana Cloud Bill
An Accidental Huge Bill
At the beginning of this month (August 1st, 2025), in the middle of the night while trying to recover from jet lag, I received a notification that made me wide awake: Grafana was charging me $76.91 for Prometheus metrics. This was a huge jump considering I'd been paying them $0 for over a year, as my usage was well under their 10k active series free tier threshold.
While $76 might not ring the bill in a fortune 500 environment, it's non-trivial for an one-man consulting business.
Since sleep was now impossible, I decided to investigate immediately.
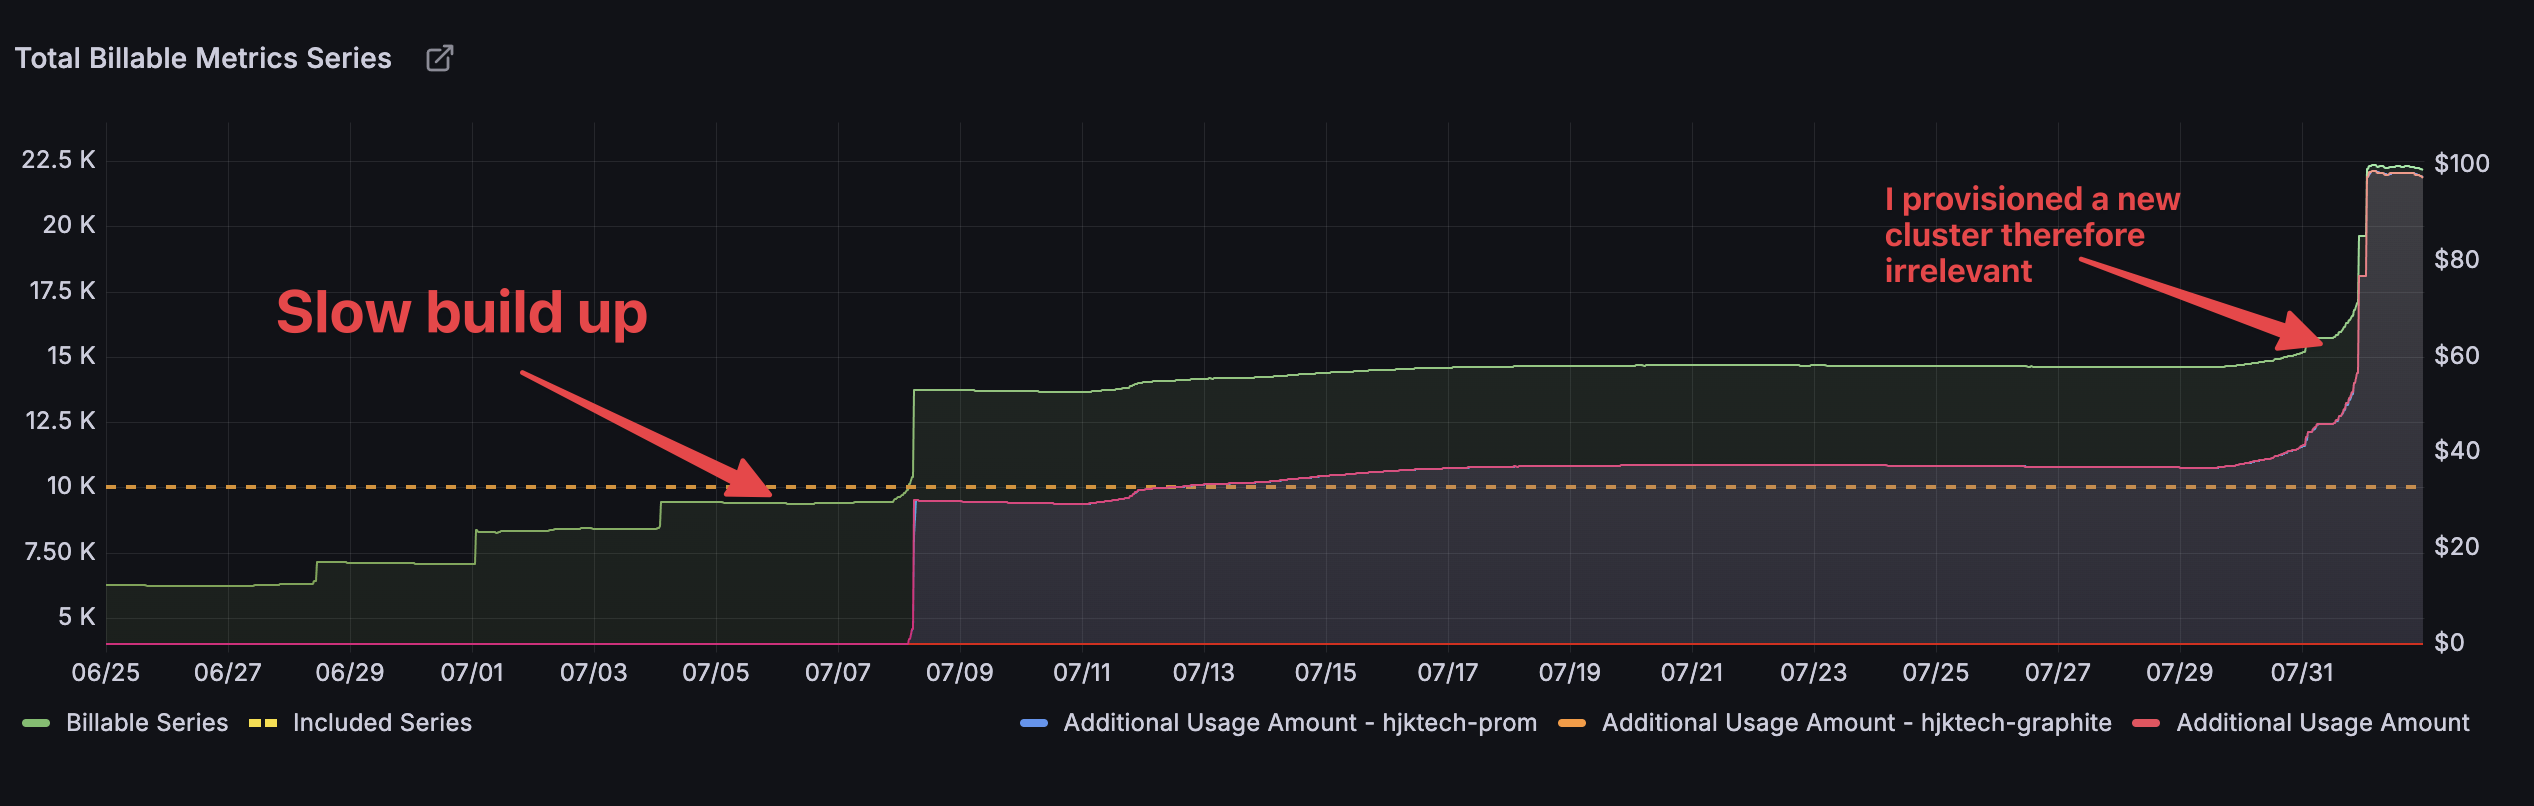
Looking at the billing dashboard, not only would I be charged $76.91 for July, but my August bill was projected to hit $100 if I didn't take action immediately.
This was a disaster that needed immediate attention.
First Suspicion: Cardinality Explosion
Cardinality is the usual suspect when it comes to Prometheus cost explosions. I logged into Grafana Cloud and opened the cardinality management dashboard (typically at https://$your_account_name.grafana.net/d/cardinality-management/cardinality-management-1-overview).
Within seconds, I spotted the culprit: http_request_duration_seconds_bucket had completely run away.
Drilling down into this specific metric revealed that the path label was out of control, filled with all kinds of bot traffic patterns probing public endpoints. Fortunately, the metric had a k8s.grafana.com/job label that pointed me to the responsible application.
The problematic code looked like this:
func Observe() gin.HandlerFunc {
    return func(c *gin.Context) {
        start := time.Now()

        // context correlation
        correlationID := uuid.New().String()
        reqLog := logger.G(c.Request.Context()).WithFields(logrus.Fields{
            "correlation_id": correlationID,
            "method":         c.Request.Method,
            "path":           c.Request.URL.Path,
            "remote_ip":      c.ClientIP(),
        })
        c.Request = c.Request.WithContext(logger.WithLogger(c.Request.Context(), reqLog))

        defer func() {
            latency := time.Since(start)

            // logging
            reqLog := logger.G(c.Request.Context())
            reqLog.WithFields(logrus.Fields{
                "latency_ms":  latency.Milliseconds(),
                "status_code": c.Writer.Status(),
                "status":      c.Writer.Status(),
            }).Info("request completed")

            // metrics
            metrics.HttpRequestsTotal.WithLabelValues(
                fmt.Sprintf("%d", c.Writer.Status()),
                c.Request.Method,
                c.Request.URL.Path,  // <-- This is the problem!
            ).Inc()

            metrics.HttpRequestDuration.WithLabelValues(
                fmt.Sprintf("%d", c.Writer.Status()),
                c.Request.Method,
                c.Request.URL.Path,  // <-- This is the problem!
            ).Observe(latency.Seconds())
        }()
        c.Next()
    }
}
The issue was clear: when external bots probed random paths, the path label exploded the cardinality.
In retrospect, for paths that don't match known route patterns, I should have grouped them into a single path="unknown" label value. Interestingly, I'd already covered this edge case in another project months ago:
func (s *Service) MetricsMiddleware() gin.HandlerFunc {
    return func(c *gin.Context) {
        start := time.Now()
        s.metrics.httpRequestsInFlight.Inc()

        // Process request
        c.Next()

        // Collect metrics
        duration := time.Since(start)
        endpoint := c.FullPath()
        if endpoint == "" {
            endpoint = "unknown"  // <-- Group unknown paths!
        }

        s.metrics.httpRequestsTotal.WithLabelValues(
            c.Request.Method,
            endpoint,
            strconv.Itoa(c.Writer.Status()),
        ).Inc()

        s.metrics.httpRequestDuration.WithLabelValues(
            c.Request.Method,
            endpoint,
        ).Observe(duration.Seconds())

        s.metrics.httpRequestsInFlight.Dec()
    }
}
Immediate Mitigation: Stop the Metrics Scraping
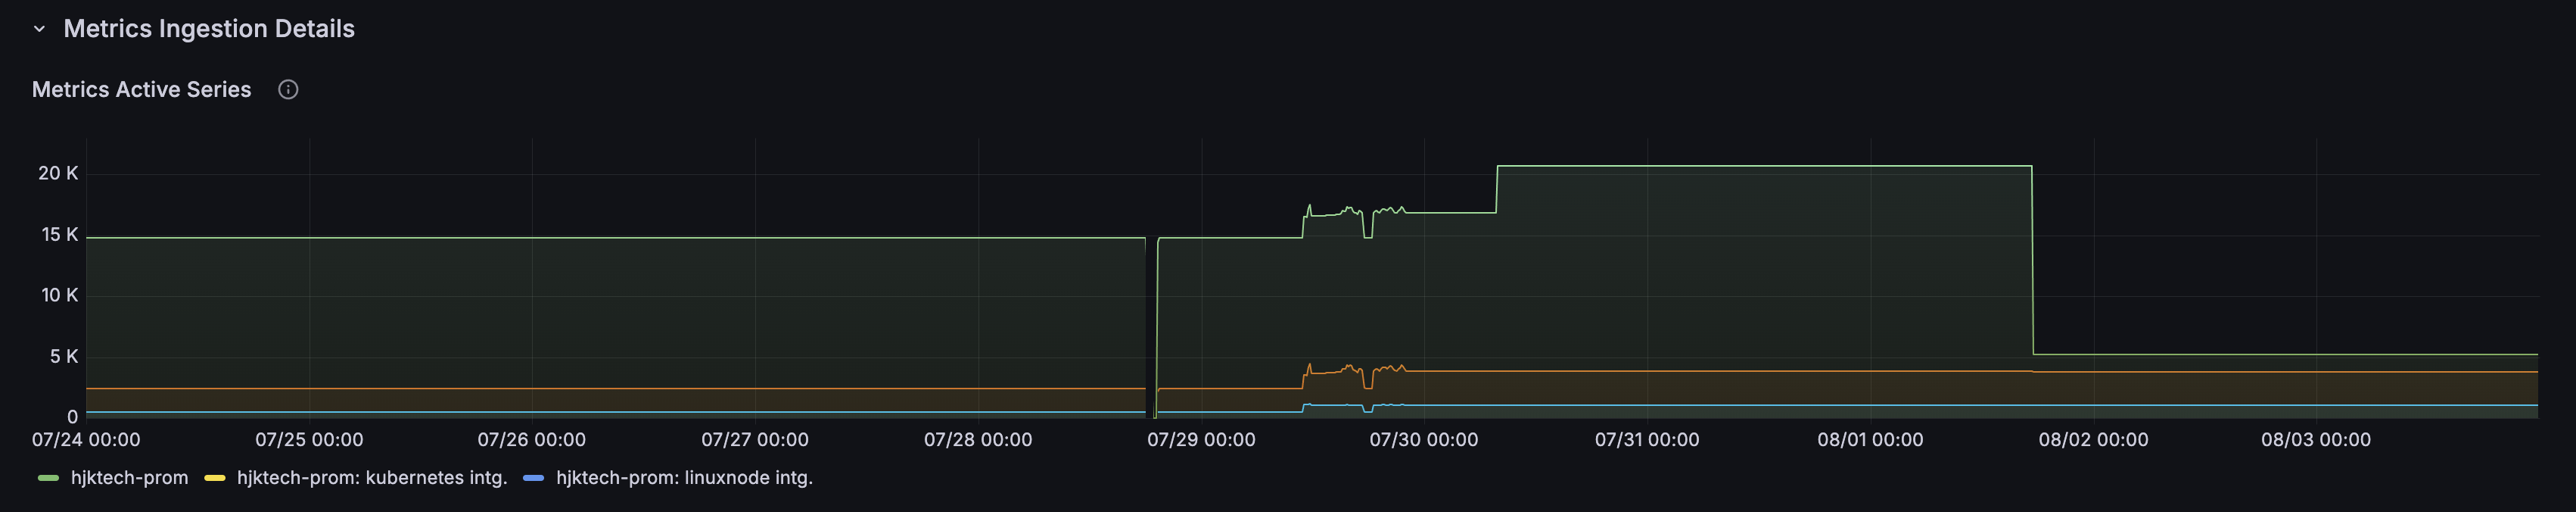
I immediately removed the Prometheus scraping annotation from the deployment, which stopped metrics collection instantly.
The effect was immediate - active series count dropped well below the 10k threshold:
Next Steps: Requesting a Waiver (Carefully!)
Since the usage spike was completely unintentional and caused by bot probing, I reached out to Grafana support to request a bill waiver. Initially, I received a firm "no", but after explaining the situation they agreed to submit a refund request as a "one-time courtesy."
Here's where it got interesting: they could only waive one month. With $76.91 for July and a projected $100 for August, I had a tough choice. The support representative suggested waiving August's $100 bill as it was higher.
However, as an experienced Grafana user, I knew this was the worse option! Here's why:
Grafana Cloud Prometheus billing works on the 95th percentile of active series at the end of the month. Since the high usage in August only persisted for 17 hours, the math worked in my favor:
(24 * 30 - 17) / (24 * 30) = 0.976
This represents the 97.6th percentile of the month. If I kept active series under 10k for the rest of August, my 95th percentile would remain under 10k, resulting in a $0 bill for August!
Therefore, I requested to waive July's $76.91 instead of August's projected $100, and they agreed.
But Was I Right?
Initially, the billable series count barely dropped even after remediation:
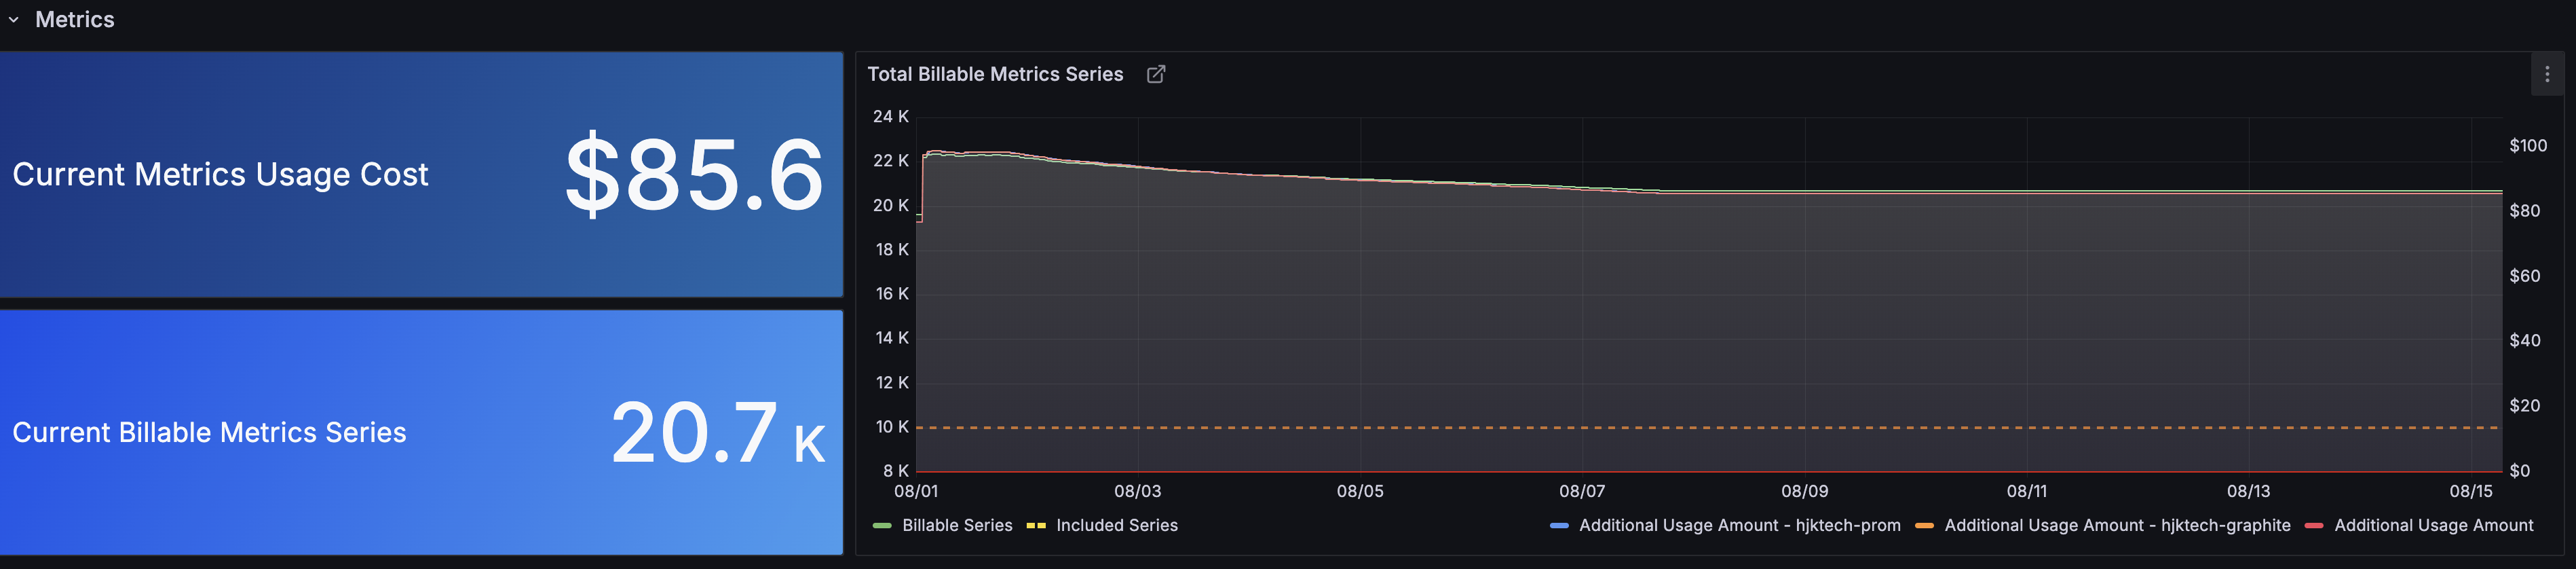
Don't panic! This is because the 95th percentile effect hadn't kicked in yet. You need to wait long enough for the high active series data points to fall outside the p95 window.
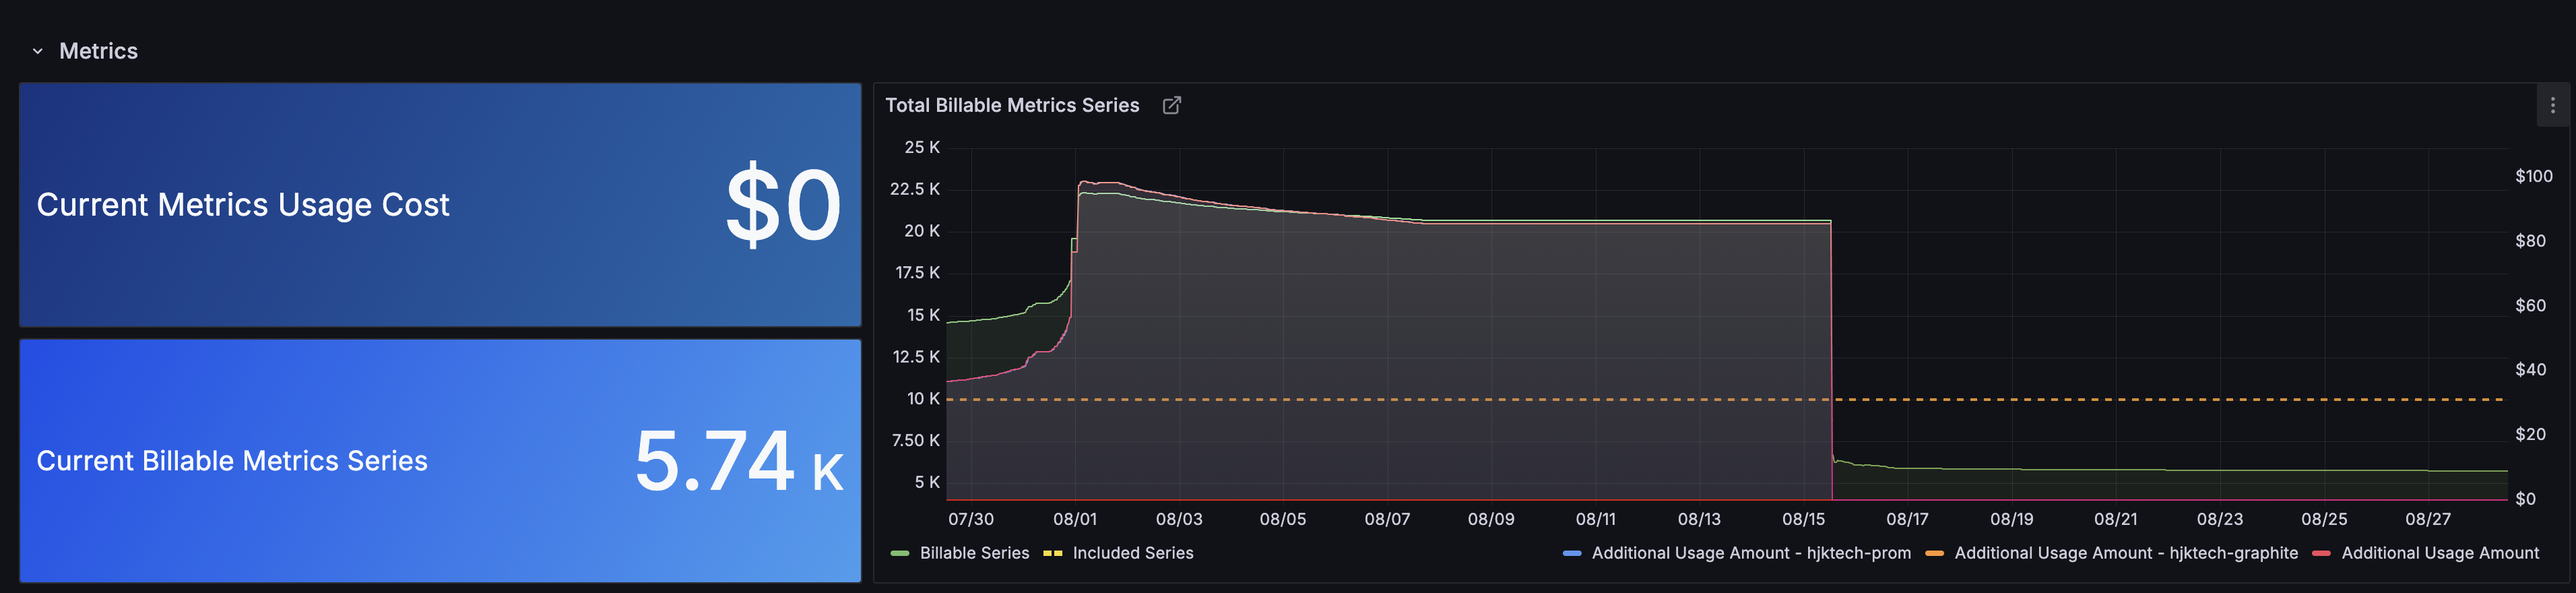
As shown in the second screenshot, the August bill dropped to $0 by mid-month.
Success! I essentially paid $0 for both July and August, instead of $176.91 if I hadn't taken action.
Final Thoughts
This was a close call and I need to be more careful about metrics cardinality in the future - especially for public-facing endpoints.
Key takeaways:
- Always use fixed endpoint names for metrics labels, grouping unknown paths as "unknown"
- Set up alerting on active series count to catch issues before they escalate
- Understand your cloud provider's billing model (the p95 calculation saved me $100!)
- Act quickly but think strategically when dealing with billing issues
I'm pleased that I managed to turn this potential disaster around with minimal cost and now have a solid playbook for handling similar situations in the future.